Every real estate portfolio carries climate risk. The question is no longer whether your assets are exposed, but which ones, to which hazards, and how much it will cost you if you do nothing.
That question is being asked with increasing precision: by lenders during financing and refinancing, by investors during due diligence, by regulators through the EU Taxonomy and CSRD, and by insurers repricing coverage in flood- and heat-exposed markets. An answer at the level of "our portfolio is mostly fine" no longer holds. What holds is a forward-looking asset-by-asset climate risk assessment: every building, every relevant hazard, scored on the same methodology, with a clear line from exposure to financial impact to action.
This guide walks through how to do exactly that.
What is physical climate risk in real estate?
Physical climate risk is the risk of financial loss from climate-related hazards acting on a physical asset. In real estate, it shows up in very concrete ways: flood damage e.g. to a logistics facility, cooling costs and tenant discomfort in an overheating office, structural damage from windstorms, business interruption after a wildfire, or water-supply constraints that limit how a site can operate.
It sits alongside transition risk, the cost of regulation, carbon pricing, and shifting market expectations. But the two behave differently. Transition risk is largely a function of a building's energy and carbon performance. Physical climate risk is a function of where the building stands and what it is made of. Two identical assets in Rotterdam and Madrid face entirely different hazard profiles. That is why physical risk can only be assessed asset by asset, on location.
The five physical hazards that matter most for real estate
A credible climate risk assessment covers, at minimum, these hazard families, each assessed with its own data sources and logic:
-
Flood (riverine, pluvial, and coastal). The single largest driver of climate-related property damage in Europe, according to the European Environment Agency is flood risk. Assessed by combining hazard maps, hydrological models, soil capabilities and geo-locating slopes with the asset's exact location, elevation, and, where available, ground-floor use and existing protection measures. A building 40 metres from a flood zone boundary and a building inside it are different risks. Portfolio-average views hide that.
-
Heat stress. Rising average temperatures and more frequent heatwaves affect cooling loads, equipment lifespan, tenant wellbeing, and, increasingly, lettability. Assessed through projected temperature and heatwave-frequency data under climate scenarios, combined with building characteristics such as glazing, insulation, and cooling capacity.
-
Wildfire. Relevant not only in Southern Europe. Assessed through vegetation, land-use, and fire-weather data around the asset's location, plus proximity to the wildland-urban interface.
-
Windstorm. Storm intensity and frequency projections combined with building height, age, roof type, and construction standard. Older stock built to outdated wind-load codes carries measurably more exposure.
-
Water stress. A long-horizon risk to operations and asset value in regions where water availability is declining. Especially relevant for hotels, healthcare, data centres, and any water-intensive use.
Each hazard is scored separately, because they demand different responses. A flood-exposed asset needs different capex than a heat-exposed one, and an asset can score low on four hazards and critically on the fifth.
From one asset to a whole portfolio: how the scoring works
The methodology is the same whether you assess one building or two thousand. What changes is the aggregation.
-
At asset level, each building is geolocated and matched against hazard datasets and forward-looking climate model projections. The result is a hazard-by-hazard risk score for that specific asset. Not for its postcode, not for its city. Scores are typically expressed under multiple climate scenarios (for example RCP 4.5 and RCP 8.5) and across time horizons.
-
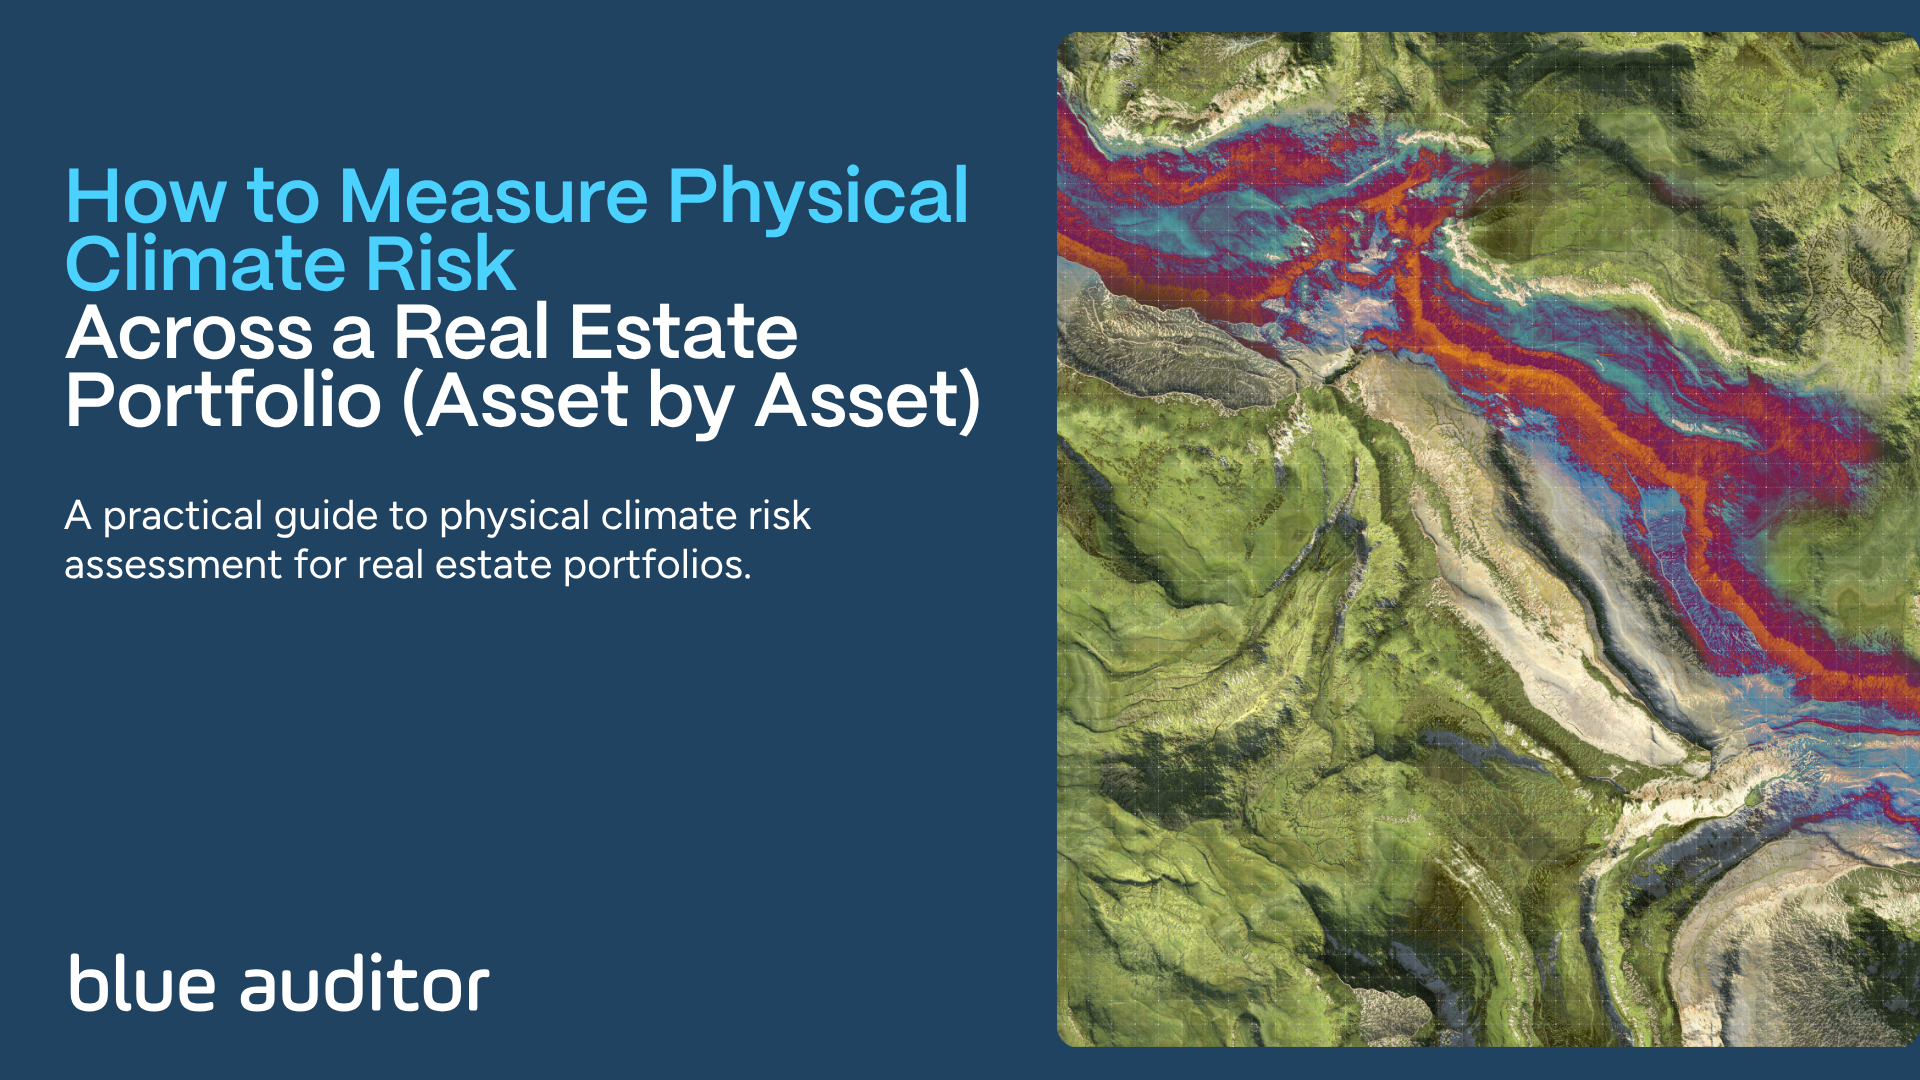
At portfolio level, those asset scores roll up into an exposure map: which share of portfolio value sits in high-risk locations, which hazards dominate, which countries or funds concentrate the risk. This is the view lenders and investment committees actually ask for, and it is only trustworthy if it is built bottom-up from asset-level data.
-
The data you need to start is deliberately minimal. Address (or coordinates), building type, and year of construction are enough for a first exposure screening. Floor area, construction details, and protection measures refine the picture. Financial value-at-risk closes the gap to the actual expected loss over time. This matters in practice: you do not need a fully digitised portfolio to begin a climate risk assessment. In platforms like Blue Auditor, asset lists can be uploaded from a simple spreadsheet, validated automatically, and enriched over time. The same asset records then feed reporting, retrofit planning, and risk work without double entry.
How long does it take, and how granular are the results?
This is where modern climate risk software has changed the economics of the exercise. What used to be a months-long consulting engagement per fund is now a data workflow.
With a clean asset list, an initial portfolio-wide exposure screening is a matter of hours or at most a few days, not months, including for portfolios spanning hundreds of assets across multiple countries. Results are granular on two dimensions:
- Spatially: every score is asset-specific, based on the building's actual location and characteristics.
- Temporally: projections run decade by decade out to 2099, under multiple climate scenarios. You see not just today's exposure but how a hazard develops over the holding period. That is precisely the horizon that matters for a 10-year hold, a 30-year loan, or a fund's terminal value assumption.
That temporal depth is what separates a compliance checkbox from a decision tool. A flood risk that materialises in the 2040s is irrelevant for a three-year hold and decisive for a core long-term strategy.
Using climate risk assessment in acquisition due diligence
Acquisition teams are quietly becoming the biggest users of physical climate risk data, because the cheapest moment to manage climate risk is before you own the asset.
A practical due-diligence workflow looks like this:
- Screen early. Run the target asset (or target portfolio) through an exposure screening at the longlist stage. Address and asset type are enough. High-risk flags surface before you spend on technical DD.
- Deepen where it matters. For flagged assets, look hazard by hazard: what drives the score, under which scenario, on what timeline. A high heat-stress score in the 2050s reads very differently from acute flood exposure today.
- Price it in. Translate exposure into expected damages and adaptation capex, and reflect both in the underwriting model, whether as a price adjustment, a capex reserve, or a walk-away trigger.
- Document it. Keep the assessment, methodology, and evidence in the deal file. It will be asked for, by the investment committee, the lender, and eventually the auditor.
Buyers who screen systematically also gain a negotiation advantage: climate exposure that the seller has not quantified is, in effect, an information asymmetry working in your favour.
Prioritising at-risk assets and building an adaptation plan
An exposure map is only the starting point. The operational question is: which assets first, and which measures?
A defensible prioritisation combines three lenses:
- Severity and timing. How high is the risk, and when does it materialise relative to your hold period?
- Value at stake. A medium risk on a flagship asset can outrank a high risk on a small one.
- Cost and effectiveness of adaptation. Some exposures are cheap to mitigate (flood barriers, sealed ground floors, external shading); others are structural.
From there, exposure turns into a plan: adaptation measures per asset, with cost, impact, and payback, assigned to owners with deadlines, and tracked against progress. The same logic applies to decarbonisation retrofits, and the two are best planned together, because a facade renovation is the moment to address both heat stress and energy performance in one capex event, not two.
This is where an integrated platform earns its keep over standalone risk reports. In Blue Auditor, climate exposure scores, retrofit pathways, and task workflows sit on the same asset records, so an identified risk becomes an assigned, budgeted, trackable action rather than a PDF in a folder.
Connecting physical risk to Climate VaR and EU Taxonomy alignment
Two extensions turn a physical risk score into a finance- and compliance-grade instrument.
-
Climate Value at Risk (Climate VaR). Hazard scores answer "how exposed is this asset?" Climate VaR answers the question your CFO and lender actually ask: "what does that exposure cost?" It models expected damages and losses per asset under climate scenarios and expresses them as a share of asset value. That makes climate risk comparable to every other financial risk in the portfolio, and makes adaptation capex a return-on-investment conversation rather than a sustainability one.
-
EU Taxonomy: the climate adaptation DNSH check. Any real estate activity claiming Taxonomy alignment, under climate change mitigation for instance, must pass the Do No Significant Harm criterion for climate change adaptation. That requires a robust climate risk and vulnerability assessment covering the relevant physical hazards over the asset's expected lifetime, plus adaptation solutions where material risks are identified. In other words: an asset-level physical climate risk assessment is not optional for Taxonomy reporting; it is a formal prerequisite. Running the risk assessment and the Taxonomy assessment on the same data, in the same system, removes an entire layer of duplicated work. That is one reason asset managers increasingly look for real estate ESG software that handles both natively rather than stitching together point solutions.
Where to start
If you take one thing from this guide, take the sequencing:
- Assemble a basic asset list: addresses, types, construction years.
- Run a portfolio-wide exposure screening across all five hazard families, under multiple scenarios, to 2099.
- Identify the concentration: which assets, which hazards, which decades.
- Quantify the financial impact via Climate VaR.
- Turn the top exposures into an adaptation plan with owners, budgets, and deadlines, and reuse the same assessment for your EU Taxonomy DNSH evidence.
Physical climate risk is one of the few risks in real estate that can be mapped this precisely, this early, at this low a cost. The portfolios that measure it asset by asset will price it, plan for it, and report it. The ones that don't will discover it in their insurance renewals, their refinancing terms, or their exit valuations.
Blue Auditor's Climate Exposure & Financial Risk module scores every asset in your portfolio across flood, heat stress, wildfire, windstorm, and water stress, decade by decade to 2099, and connects the results directly to Climate VaR, retrofit planning, and EU Taxonomy reporting