
Most real estate teams have made peace with physical risk. Flood maps are familiar. Heat stress and subsidence sit in the due diligence pack. You can point at a location on a map and say, that one.
Transition risk is harder to hold. It has no coastline and no hazard layer. It arrives as a directive transposed into national law, a carbon price attached to a gas bill, a tenant shortlist you didn't make, a lender's revised terms. It is diffuse, and because it is diffuse it often gets summarised in an investment committee paper as "regulatory headwinds" and moved past.
That is a costly simplification. Transition risk is where the near-term euros are. Physical risk mostly plays out over decades; transition risk lands inside a typical hold period.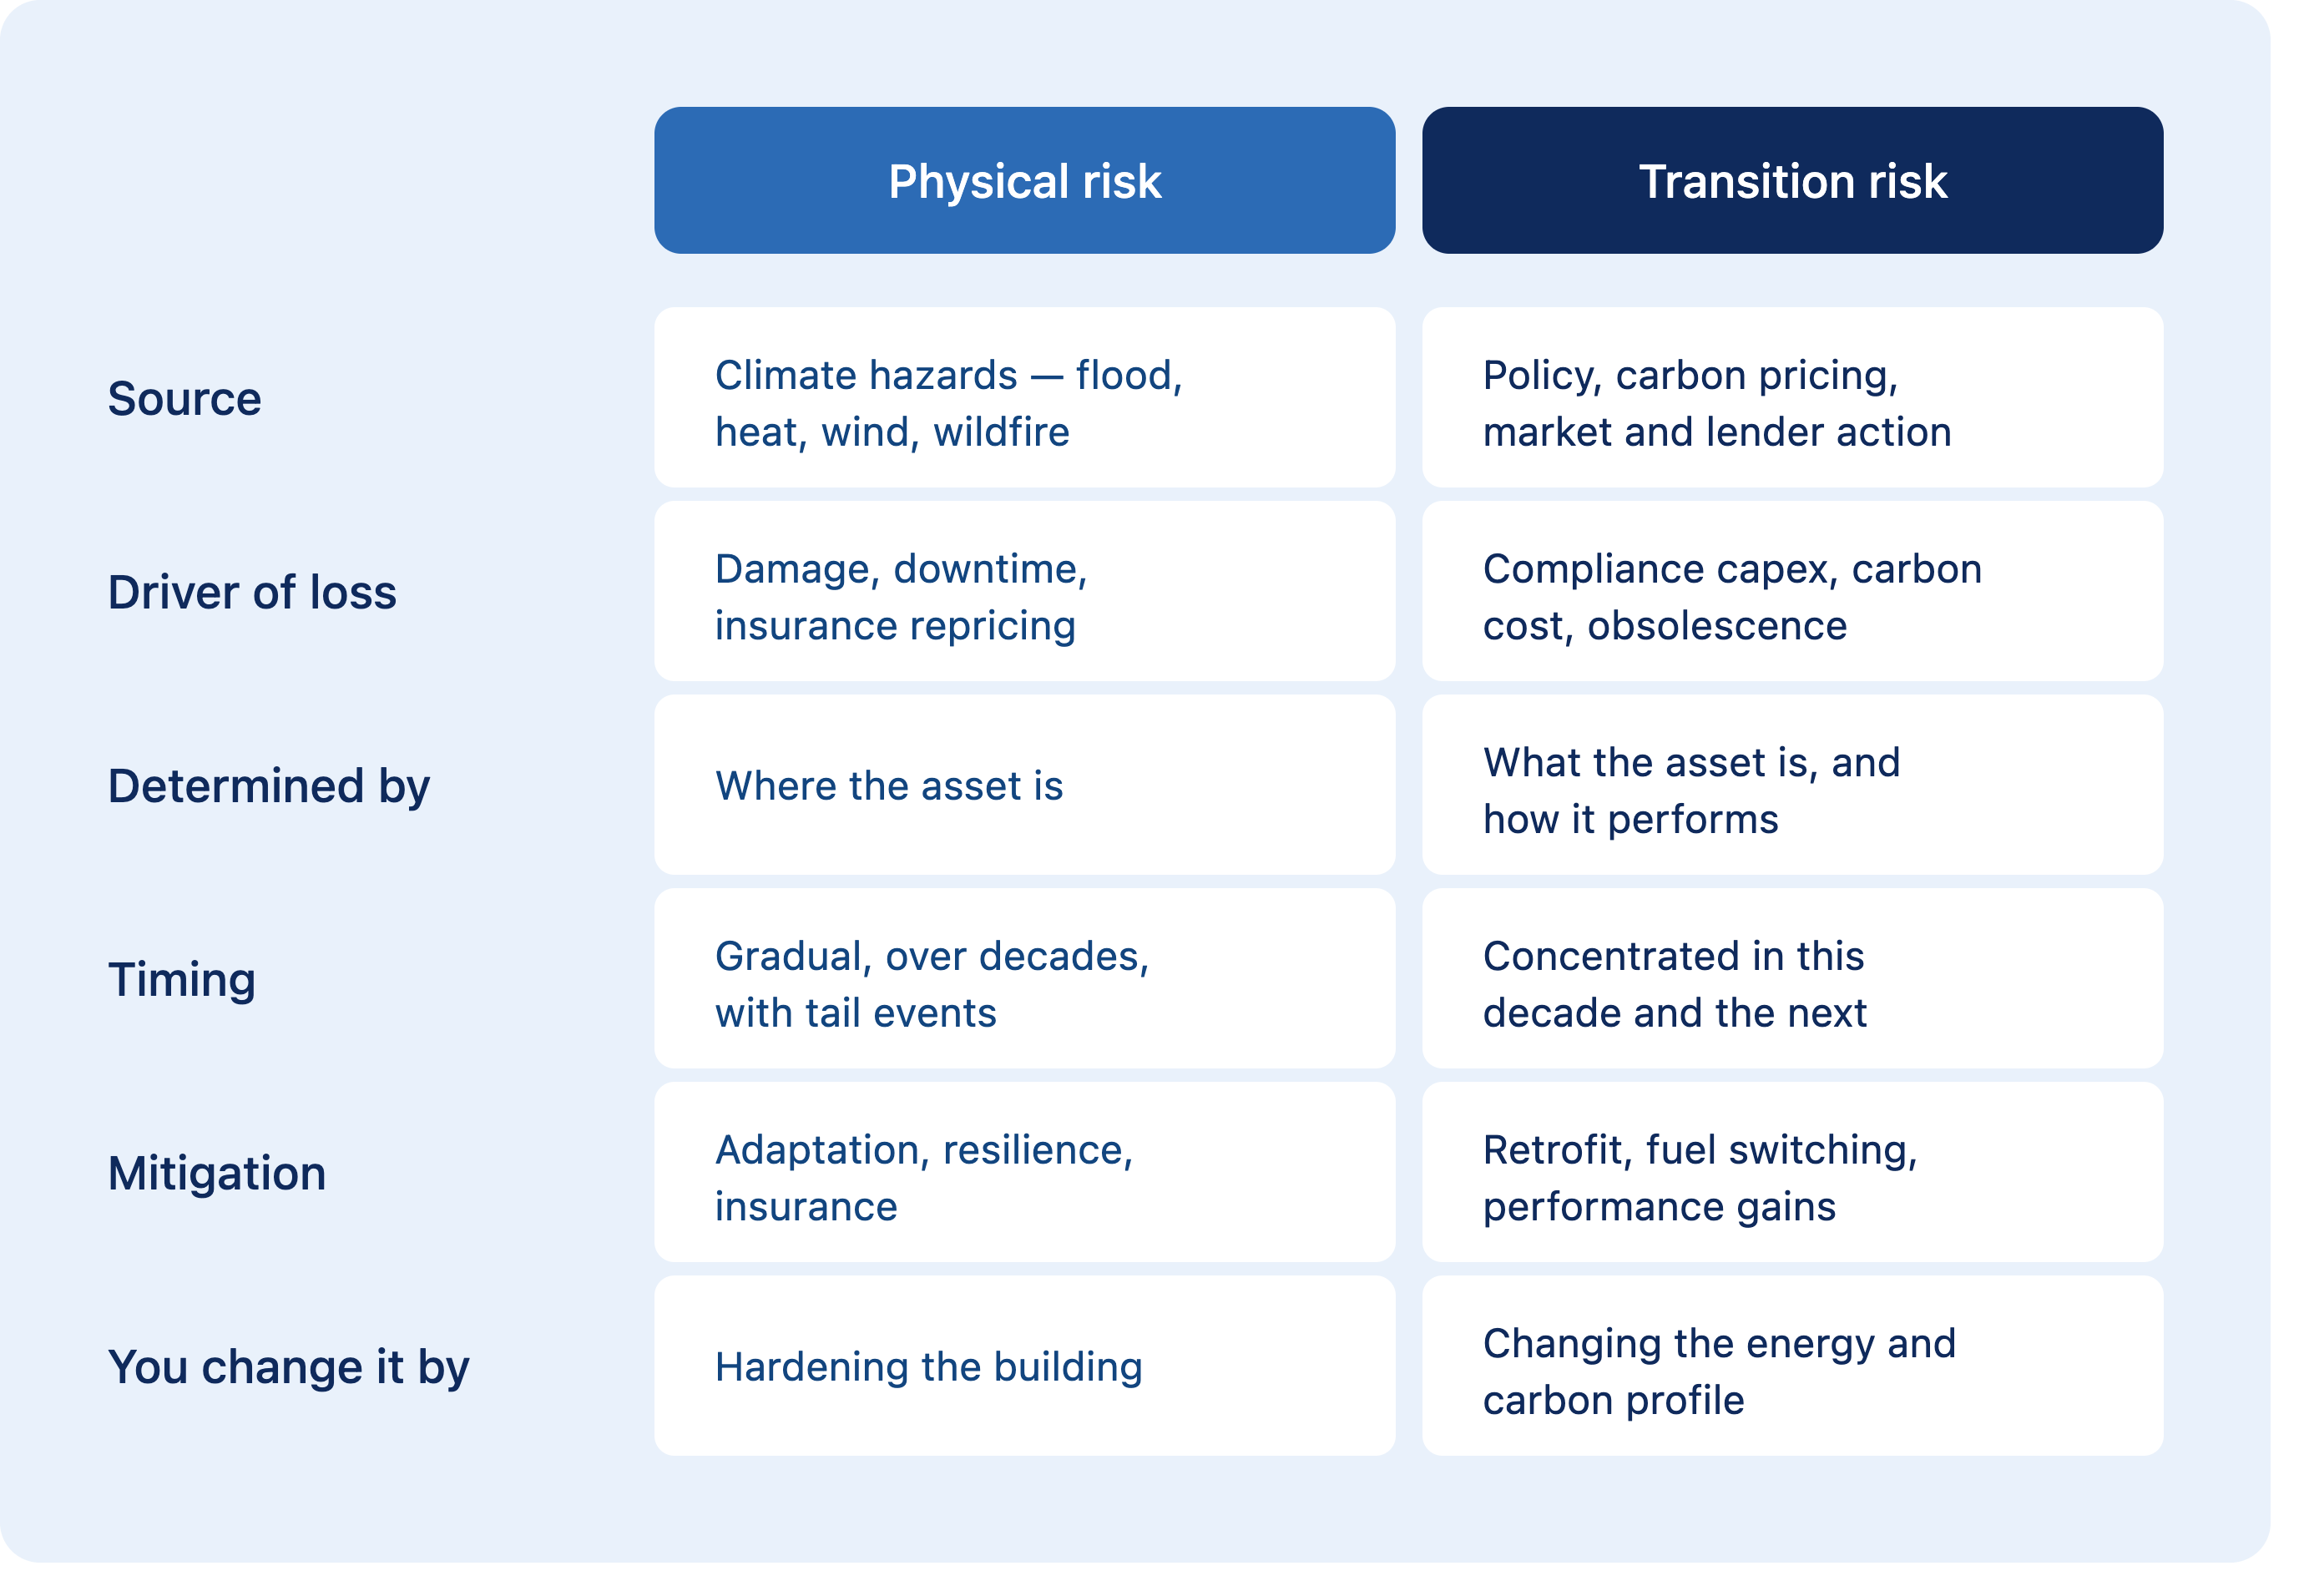
The distinction that matters operationally: you cannot move an asset out of a floodplain, but you can move it out of the worst-performing quartile. Transition risk is the half you can actually manage down, which is exactly why it belongs in a business plan and not only in a disclosure annex.
The four drivers that matter in Europe and why
1. Carbon pricing reaches buildings. ETS2 compliance starts on 1 January 2028, delayed by a year from the original 2027 date, with allowance auctioning beginning in 2027. The obligation sits upstream with fuel suppliers, so it will not arrive as an invoice addressed to you. It arrives inside the gas price. For a gas-heated asset with weak fabric, that is a permanent increase in operating cost, and a price signal that quietly reprices the retrofit business case in favour of acting sooner.
2. Energy performance regulation with teeth. The recast EPBD (Directive (EU) 2024/1275) had a transposition deadline of 29 May 2026, so national rules are landing now. For non-residential stock, Member States must set minimum energy performance standards that bring the worst-performing 16% above threshold by 2030 and 26% by 2033. Residential is handled as a stock-level trajectory: average primary energy use down at least 16% by 2030 and 20 to 22% by 2035, with at least 55% of that reduction coming from the worst-performing 43% of homes. From 2028, new public buildings must be zero-emission. From 2030, all new buildings. Fossil fuel boilers are on a path to phase-out by 2040.
Read that carefully and you will notice the mechanism. MEPS are relative, not absolute. Your asset is not measured against a fixed kWh/m² line. It is ranked against the national stock as it stood on 1 January 2020. You can hold performance flat and still fall into scope as the market improves around you.
3. Occupier and investor demand. Corporate tenants with their own carbon commitments increasingly filter buildings before they view them. This shows up first as a longer void, then as an incentive package, then as a rent that never recovers.
4. Lending and refinancing. Banks price collateral quality. An asset with a credible pathway and evidence to support it is a different credit conversation from one with a 2038 refinancing and an unfunded CapEx liability.
Putting a number on it
The move from "this feels risky" to "this is worth €3.4m" runs through four steps.
Establish the baseline. Actual metered consumption, fuel mix, floor area, EPC data and asset characteristics. Not modelled defaults. Transition risk numbers are only as good as the consumption data underneath them, which is why the metering layer is not an afterthought.
Project the cost of doing nothing. Model forward carbon cost on the asset's own fuel mix, plus the CapEx implied by national MEPS thresholds on the timeline they bite, plus the value effect of falling out of the marketable segment.
Translate to euros with Climate Value-at-Risk. Climate VaR expresses the discounted financial impact as a percentage of asset value, so transition risk sits on the same page as physical risk and can be aggregated across a portfolio. We covered the method in detail in our post on Climate VaR.
Test it against the stranding date. Decarbonisation pathways tell you the year an asset's intensity crosses the decarbonisation trajectory for its type and country. That date is the deadline your CapEx plan has to beat. More on that in our decarbonisation post.
Where it actually lands in valuation
Four transmission channels, and they compound:
- Yield shift. A non-compliant asset in a market with compliant alternatives trades at a discount. This is the largest and least visible effect.
- Void and letting risk. Longer marketing periods, higher incentives, weaker covenant strength.
- CapEx liability. Compliance work is not discretionary and not deferrable past the threshold date. Priced into the bid.
- Refinancing terms. Margin, LTV, or in a hard case, willingness to lend at all.
How to rank a portfolio
Screen on four variables and the picture resolves fast: fuel mix (direct gas or oil is the sharpest signal), energy intensity relative to national stock, years to stranding, and hold period versus threshold date.
The assets that hurt most are rarely the obvious worst performers. They are the mid-table ones. An asset that looks acceptable today, sits just above the 2030 threshold, will fall below the 2033 one, and has a refinancing in between.
One plan, not three workstreams
Transition risk, decarbonisation pathways and EU Taxonomy alignment are usually run by different people on different timelines. They are the same dataset.
The transition risk assessment tells you how much is at stake and when. The retrofit pathway tells you what to do and what it costs. Taxonomy alignment turns the completed work into evidence a lender or investor can verify. Same consumption data, same asset register, same audit trail. Three outputs.
Run them separately and you will pay for the same data three times and still find the numbers do not reconcile in committee.
What to bring to the investment committee
Not a risk score. A ranked list of assets, a euro figure against each, the year the deadline lands, and the CapEx needed to move it, with the evidence behind every number traceable to a meter reading or a certificate.
That is a conversation about capital allocation. Which is what transition risk always was.
Blue Auditor models transition and physical risk on the same asset register, quantifies exposure as Climate Value-at-Risk in euros, and turns the result into costed retrofit pathways with a full audit trail.
.jpg?width=400&upsize=true&name=blogss%20visuals%20(1).jpg)