
Climate risk without vulnerability data is half the picture. Here's why the gap between exposure and financial loss is where the real decisions get made.
The numbers are no longer abstract. According to the European Environment Agency, economic losses from weather and climate-related extremes across Europe hit €59.4 billion in 2021 alone, roughly four times the average annual losses recorded across the previous decade. The trend isn't reversing. Even under a full net-zero scenario, the scientific consensus points to at least 1.6°C of global warming above pre-industrial averages by 2050. The physical risk is locked in.
The question is no longer if your portfolio is exposed. It's how much of it is actually vulnerable, and what that means in euros.
This article draws on a joint session we hosted with Moody's RMS, featuring Robert Muir-wood, former Chief Research Officer at Risk Management Solutions, alongside the Blue Auditor platform team. What emerged was a precise, operational framework for how real estate professionals should be thinking about climate risk today.
The Problem With "Climate Risk" as a Single Number
When most platforms assess climate risk, they stop at hazard and exposure. They tell you whether flood risk is high, whether heat stress is elevated, whether wildfire probability has increased. That's useful context, but it's incomplete intelligence.
The EU Taxonomy framework is explicit: climate risk assessment requires two distinct layers:
- Hazard × Exposure: what risks exist at a location, and what assets sit in their path
- Vulnerability: how sensitive a specific asset is to those hazards, given its class, construction, and any existing adaptation measures
These are not interchangeable. And confusing them leads to bad capital allocation decisions.
What the Data Actually Shows
Across large portfolio assessments conducted in Blue Auditor using Moody's RMS climate data, one pattern is consistent:
In a 2050 RCP 8.5 scenario, more than 80% of real estate assets show at least one high or red-flag climate risk.
That sounds alarming. But here's where it gets operationally interesting.
When you layer in vulnerability, the financial value actually at risk adjusted for asset type, location-specific adaptation, and existing flood defences, the picture inverts. Most assets, particularly in Northern Europe, carry low vulnerability despite high hazard exposure. Not because the risk isn't real, but because interventions at a city or municipal level are already reducing expected loss.
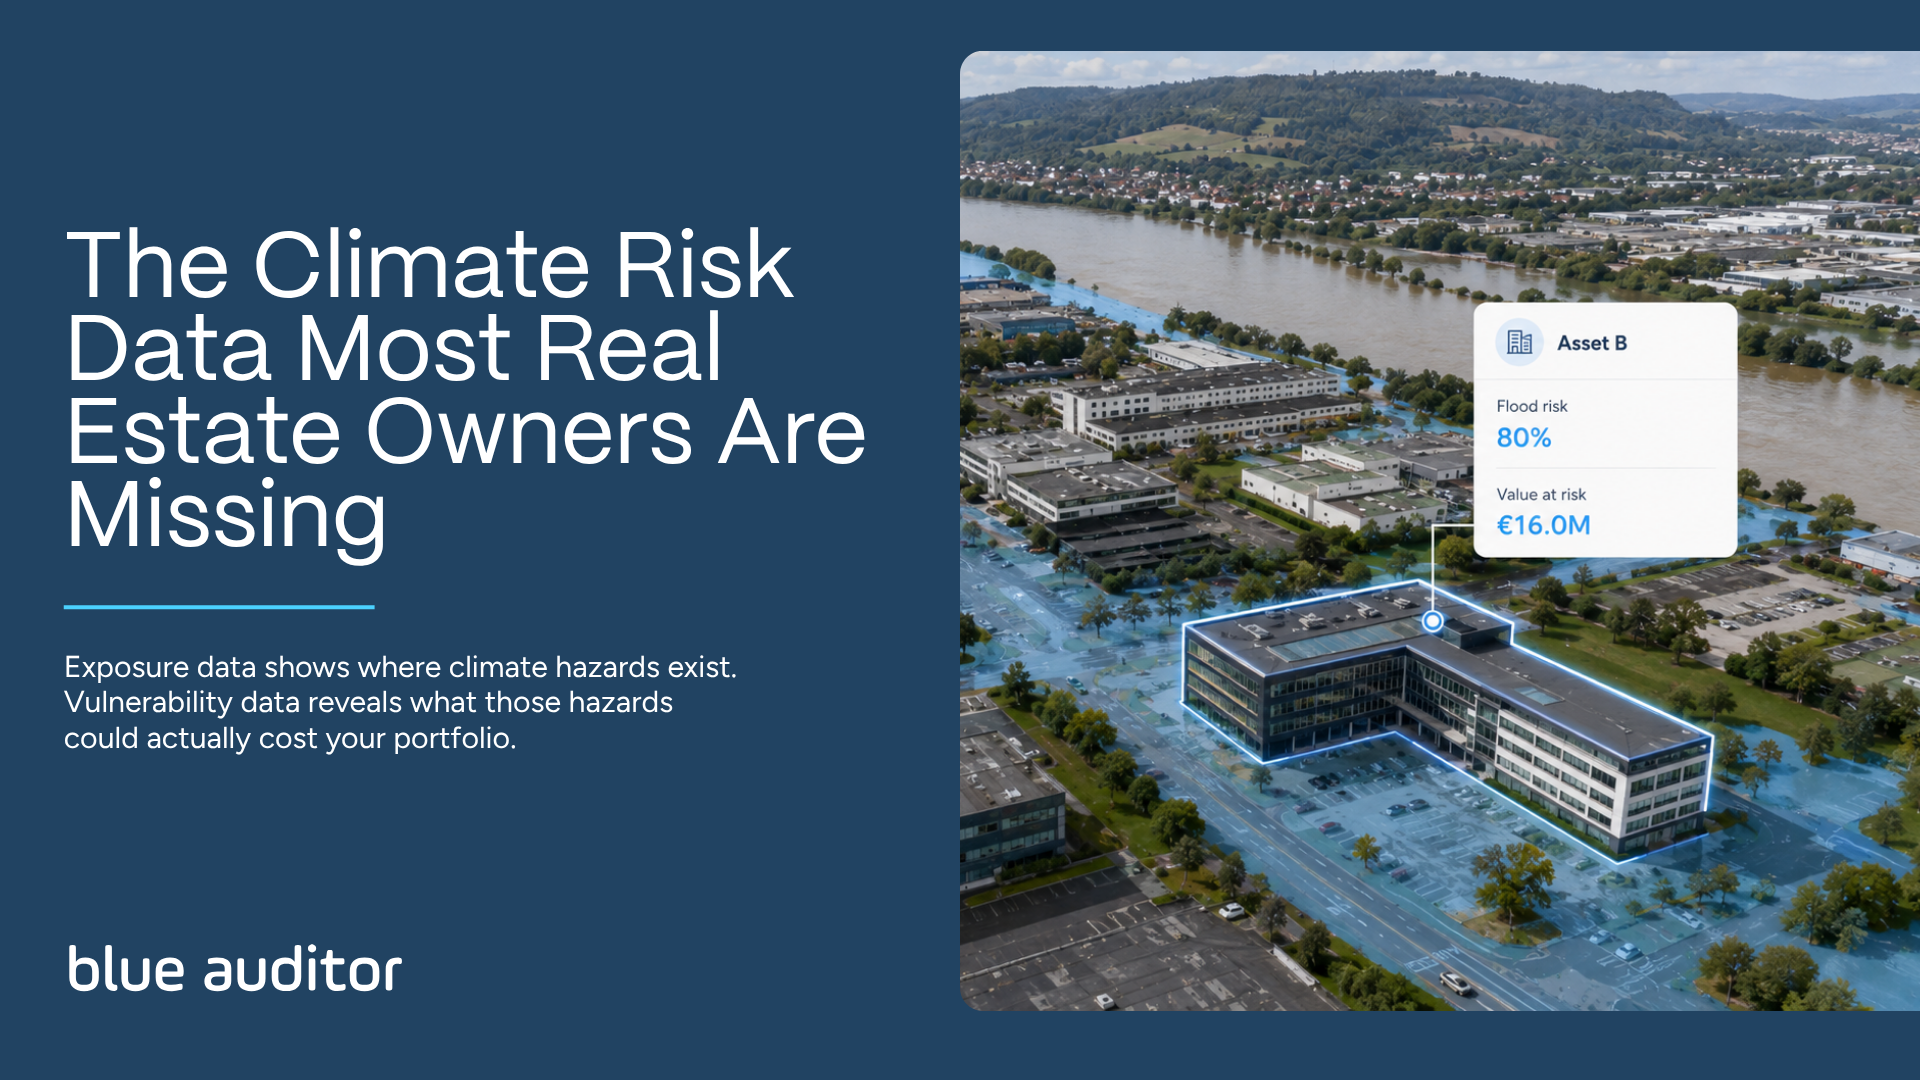
Consider two assets in the Netherlands, both flagged with roughly 80% flood risk in 2050. Side by side they look equivalent. But when vulnerability is calculated:
- Asset A: €74,000 value at risk
- Asset B: €16,000,000 value at risk
That's a 200x difference. Same hazard. Entirely different financial exposure. The delta comes down to location-specific flood infrastructure, asset class sensitivity, and building-level adaptive capacity. Without vulnerability modelling, you're making €16 million decisions on €74,000 data.
How the Risk Modelling Works
The foundation of good climate risk analysis isn't a single data source. It's a synthetic model built from hundreds of thousands of simulated event years. Moody's RMS, which contributes the physical risk intelligence integrated into Blue Auditor, runs models covering:
Acute hazards (sudden onset)
- Hurricanes and tropical cyclones (wind, storm surge, inland flooding)
- Fluvial and pluvial flooding
- Wildfire (wildland and urban spread)
- Seismic events
Chronic hazards (slow-onset)
- Heat stress and urban heat island effects
- Water stress and drought
- Sea level rise and coastal exposure
For each hazard, the model produces a vulnerability function: a precise relationship between hazard intensity and expected loss, calibrated against real insurance claims data across residential, multi-residential, commercial, and industrial building types. These functions are then projected forward under different RCP scenarios through to 2100, giving asset managers a time-resolved view of how risk evolves.
The output isn't a generic risk score. It's a financial loss estimate at a specific location, under a specific scenario, for a specific asset class.
Adaptation Has a Price and a Return
Understanding exposure and vulnerability is only the first step. The next is determining which adaptation measures can meaningfully reduce risk and whether the expected benefit justifies the investment.
For flood risk, potential interventions might range from municipal flood defences to asset-level measures such as flood-proofing basements, upgrading drainage systems or protecting critical building equipment. The effectiveness and cost of each measure will vary depending on the asset, location, hazard intensity and existing protection.
More investment does not automatically deliver proportionally greater risk reduction. Adaptation planning therefore requires a clear comparison between the cost of an intervention and its potential impact on vulnerability and expected financial loss.
This allows asset managers to prioritise the measures that offer the strongest risk reduction for the capital invested. Retrofit decisions can then be guided by asset-specific climate intelligence, rather than compliance requirements alone.
The EPBD Dimension: Compliance Is Not Optional
The revised Energy Performance of Buildings Directive (EU) 2024/1275, which entered into force in May 2024, tightens the link between building-level energy data and climate risk disclosure. For real estate professionals operating in the EU, this means:
- EPC data is no longer just an energy label. It's the input layer for EU Taxonomy technical assessments, CSRD disclosures, and SFDR alignment
- Climate risk assessment is a mandatory component of Taxonomy compliance under the Do No Significant Harm (DNSH) criterion for physical climate risks
- Vulnerability, not just hazard, must be evidenced in audit-ready reporting
The operational gap here is significant. Many asset managers have EPCs but lack the infrastructure to convert them into ESG-grade outputs at portfolio scale. Blue Auditor's EPC-to-ESG feature addresses this directly: drag-and-drop EPC ingestion, machine learning-assisted extraction, and automated climate risk and vulnerability assessment in one workflow.
What Finance-Grade Climate Intelligence Looks Like
For climate risk data to be underwritable, useful to lenders, insurers, investors, and audit teams, it needs to meet a specific standard:
✓ Asset-level granularity, not regional averages
✓ Scenario-specific outputs (RCP 4.5, RCP 8.5) across time horizons (2030, 2050, 2100)
✓ Vulnerability disaggregated from hazard: financial loss, not risk scores
✓ Adaptation pathway modelling: what interventions change the number, and by how much
✓ Audit trail: evidence that satisfies EU Taxonomy, CSRD, and GRESB reviewers
✓ Portfolio-level aggregation: consistent methodology across assets, geographies, and building types
This is the standard that institutional capital is moving toward. The gap between "we have a climate risk score" and "we have auditable, asset-level VaR with adaptation pathways" is where deal risk increasingly lives.
The Window Is Narrowing
The scientific projections are clear, the regulatory timelines are fixed, and the capital markets are already pricing in climate risk, even where asset managers aren't. The firms that build climate intelligence into their underwriting, acquisition, and asset management processes now will be positioned to act on the data. Those that don't will face repricing, stranded assets, and disclosure gaps they can't close quickly.
Climate resilience isn't a reporting exercise. It's a portfolio strategy.
See your portfolio's real vulnerability in minutes, not months.
Upload your assets, run climate risk and vulnerability assessments, and get audit-ready outputs for EU Taxonomy, CSRD, and GRESB, powered by Moody's RMS physical risk intelligence.
.jpg?width=400&upsize=true&name=blogss%20visuals%20(1).jpg)